
Valsalva Test
While Orthostatic Test is used for initial ANS assessment, the Valsalva maneuver combined with Deep Breathing is the second-tier, more in-depth test, which primary purpose is threefold:
- Revealing the hidden abilities of the Autonomic function
- Indirect assessment of the sensitivity of baroreceptors
- Distinguishing between chronic and temporary abnormalities
We recommend the Valsalva maneuver as a follow-up to Ortho test and only if it shows negative parasympathetic results, i.e., if the midpoint between the Supine and Upright positions, marked by a red dot, has a negative HF value. There are 3 result pages for Valsalva maneuver combined with deep breathing:
There are 3 result pages for Valsalva maneuver combined with deep breathing:
- Cluster Analysis
- Spectrum
- 3D Spectrum
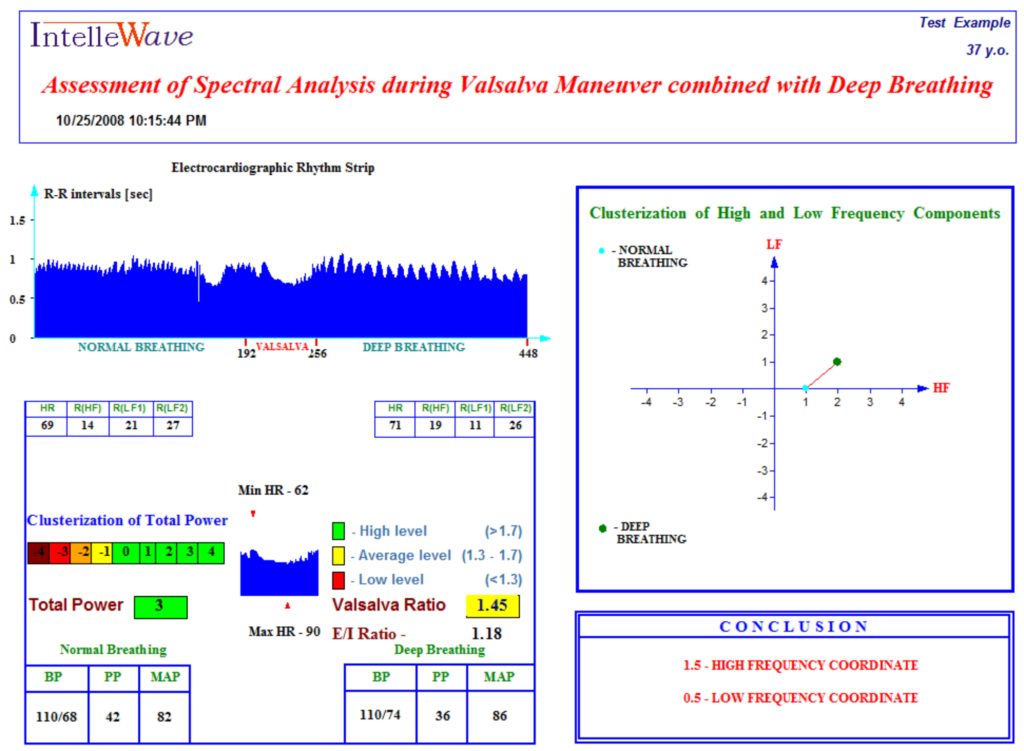
Cluster Analysis Chart
The chart displays clusterization of High Frequency and Low-Frequency components. The horizontal or X-axis shows the level of intensity of the High-Frequency component. The vertical or Y-axis shows the intensity of the Low-Frequency Component.
The goal of cluster analysis is to translate the results of the Power Spectrum analysis into the format of clusterization chart. A point on the chart reflects a distribution of intensities of High Frequency and Low-Frequency components of HRV: its x-coordinate value reflects the intensity of the High-Frequency Component, and its y-coordinate value reflects the intensity of the Low-Frequency component.
Each Cluster Analysis Chart has a light-blue and a green point. The light-blue point indicates the frequency distribution during the first main stage of the test, the green point reflects the frequency distribution during the second main stage of the test.
For Orthotest, the blue point refers to the Supine Stage of the test, and the green point refers to the Upright Stage of the test. There is also a red point in the chart for Ortho test. The red point, or Point of Average, shows an average for the two main stages. Coordinates of the Point of Average are displayed below the graph.
The diagram displayed in the left part of the panel describes the transition stage of a test. Transition stage is the part of the test during which HRV activity changes noticeably, while patient performs a transition between the activity of the first main stage to the activity of the second main stage is Valsalva Maneuver test, the transition stage is the Valsalva maneuver (the patient ends Normal Breathing, performs Valsalva Maneuver and makes a transition to Deep Breathing).
This section of the Results page contains part of the rhythmographic strip that corresponds to the transition stage, minimum and maximum Heart Rate during the stage. For Valsalva test, this section also displays the calculated Valsalva Ratio and the E/I Ratio.
Spectrum
The Spectrum page for Valsalva Maneuver combined with Deep Breathing includes the description of 2 stages of the test.
1. Description of the Normal Breathing stage is displayed on the left side of the panel.
2. Description of the Deep Breathing stage is displayed on the right side of the panel.
To generate a spectrum, Intellewave uses Fast Fourier Transform (FFT). The spectral function shown on the Spectrum Chart consists of 96 harmonics. Spectral analysis of the wave “portrait”, which appears in the rhythmographic strip panel allows Intellewave to identify two main components:
– Low frequency: 0.033 – 0.15 Hz.
– High frequency: 0.15 – 0.5 Hz.
On the horizontal or X-axis, the frequency in Hertz is shown. On the vertical or Y-axis, the amplitude of spectral harmonics is shown (S, msec2). The low and high-frequency bands can be easily identified on the chart. The vertical lines between different frequency bands show the harmonic for this frequency and an order of the harmonic is written above.
The maximums of the spectral function are shown by green triangles for each range if present.
3D SPECTRUM
This page displays a movable 3D chart of the Spectral function. Frequency (in Hz) is shown on the horizontal, or X-axis, and the amplitude of spectral harmonics (S, msec2) is shown on the vertical or Y-axis. Different frequency ranges are displayed in different colors. Two different stages of a test are displayed next to each other when the chart is viewed from the top.